
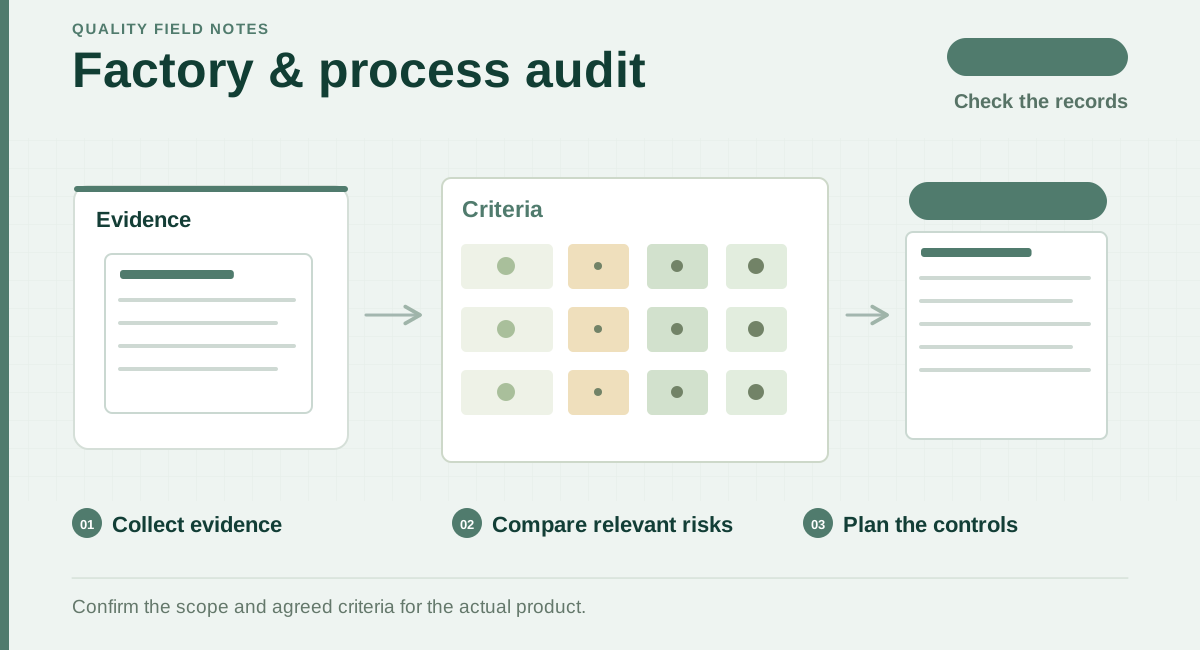
Read the diagram
- Collect evidence
Collect supplier records and product-specific facts.
- Compare relevant risks
Use agreed criteria to compare relevant risks; coloured cells illustrate categories only.
- Plan the controls
Confirm the controls and follow-up for the actual sourcing decision.
Most retailers use R/Y/G system. 85+ = Green (approve), 60-84 = Yellow (conditional), <60 = Red (reject). Industry-specific thresholds for apparel, electronics, furniture.
Use note
Articles support understanding of quality risk, standards and service routes. Formal requirements depend on the product, target market and technical project confirmation.